Objectives: To demonstrate the application of pattern recognition in describing a set or ensemble of objects in an image.
Tools: Scilab with SIP, an assembly of items with differnt shapes and sizes
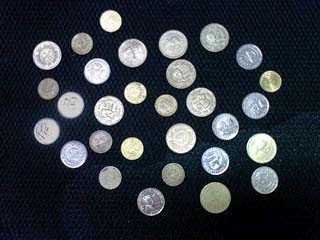
Procedure: We begin by assembling a set of 30 coins representing our test objects. We use 10 each of .25, 1 and 5 Peso coins. The size of these coins increase with their denomination hence we can use that as one of our test parameters. Also the coins have different colors with the 25-centavo coin being bright copper, the one having a silver color and the 5 having a dull yellow-green tinge. We first take five of each coin and take a picture which we will use as our training set.

We then use a binarized copy of the image to find the areas of the coins using bwlabel. We do this for all the coins in the training set and group the similar values together. We then take the first five values and find the average which will then represent the average area of the one-peso coin. We do this for the next two sets of fives to get the areas for the other two coins. Then using the original image, we find the red-channel colors of each of the coins and in a similar manner find the average values. These two values, the area and the color represent our classifiation parameters which we then apply to a test set consisting of 10 coins of each denomination. arranged randomly within the field.

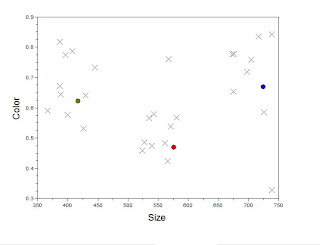
Using the same processing scheme as with the training set sans the averaging segment, we find our two classification parameters from the image and plot this with the x-axis being the area and the y-axis representing the color values of the red-channel.

Note that the cirlces represent the training parameters, that is the average color and area of each of the coins. We see a good clustering of the test points around the training values in the x-axis. This means that in terms of area, the coins in the test sample are quite distinguishable. However we still see a deviation from the ideal area which we can attribute to the changes in the area caused by the conversion from RGB to binary of the area measurement. Some of the coins shrink or expand depending on the lighting conditions and the thresholding value. Similarly in the y-axis we see a greater deviation from the average color values which again may be attributed to the lighting. Notice that the test and training images do not have exactly identical lighting conditions. As such some degree of deviation is expected. Of course this can be alleviated by employing more consistent lighting or in some cases, adding more features to test.
Evaluation: For the generally accpetable results, a grade of 10 is warranted.
Acknowledgements: The invaluable assitance of Mr. Earl Panganiban is greatly appreciated and is key to the completion of this excercise.
No comments:
Post a Comment